

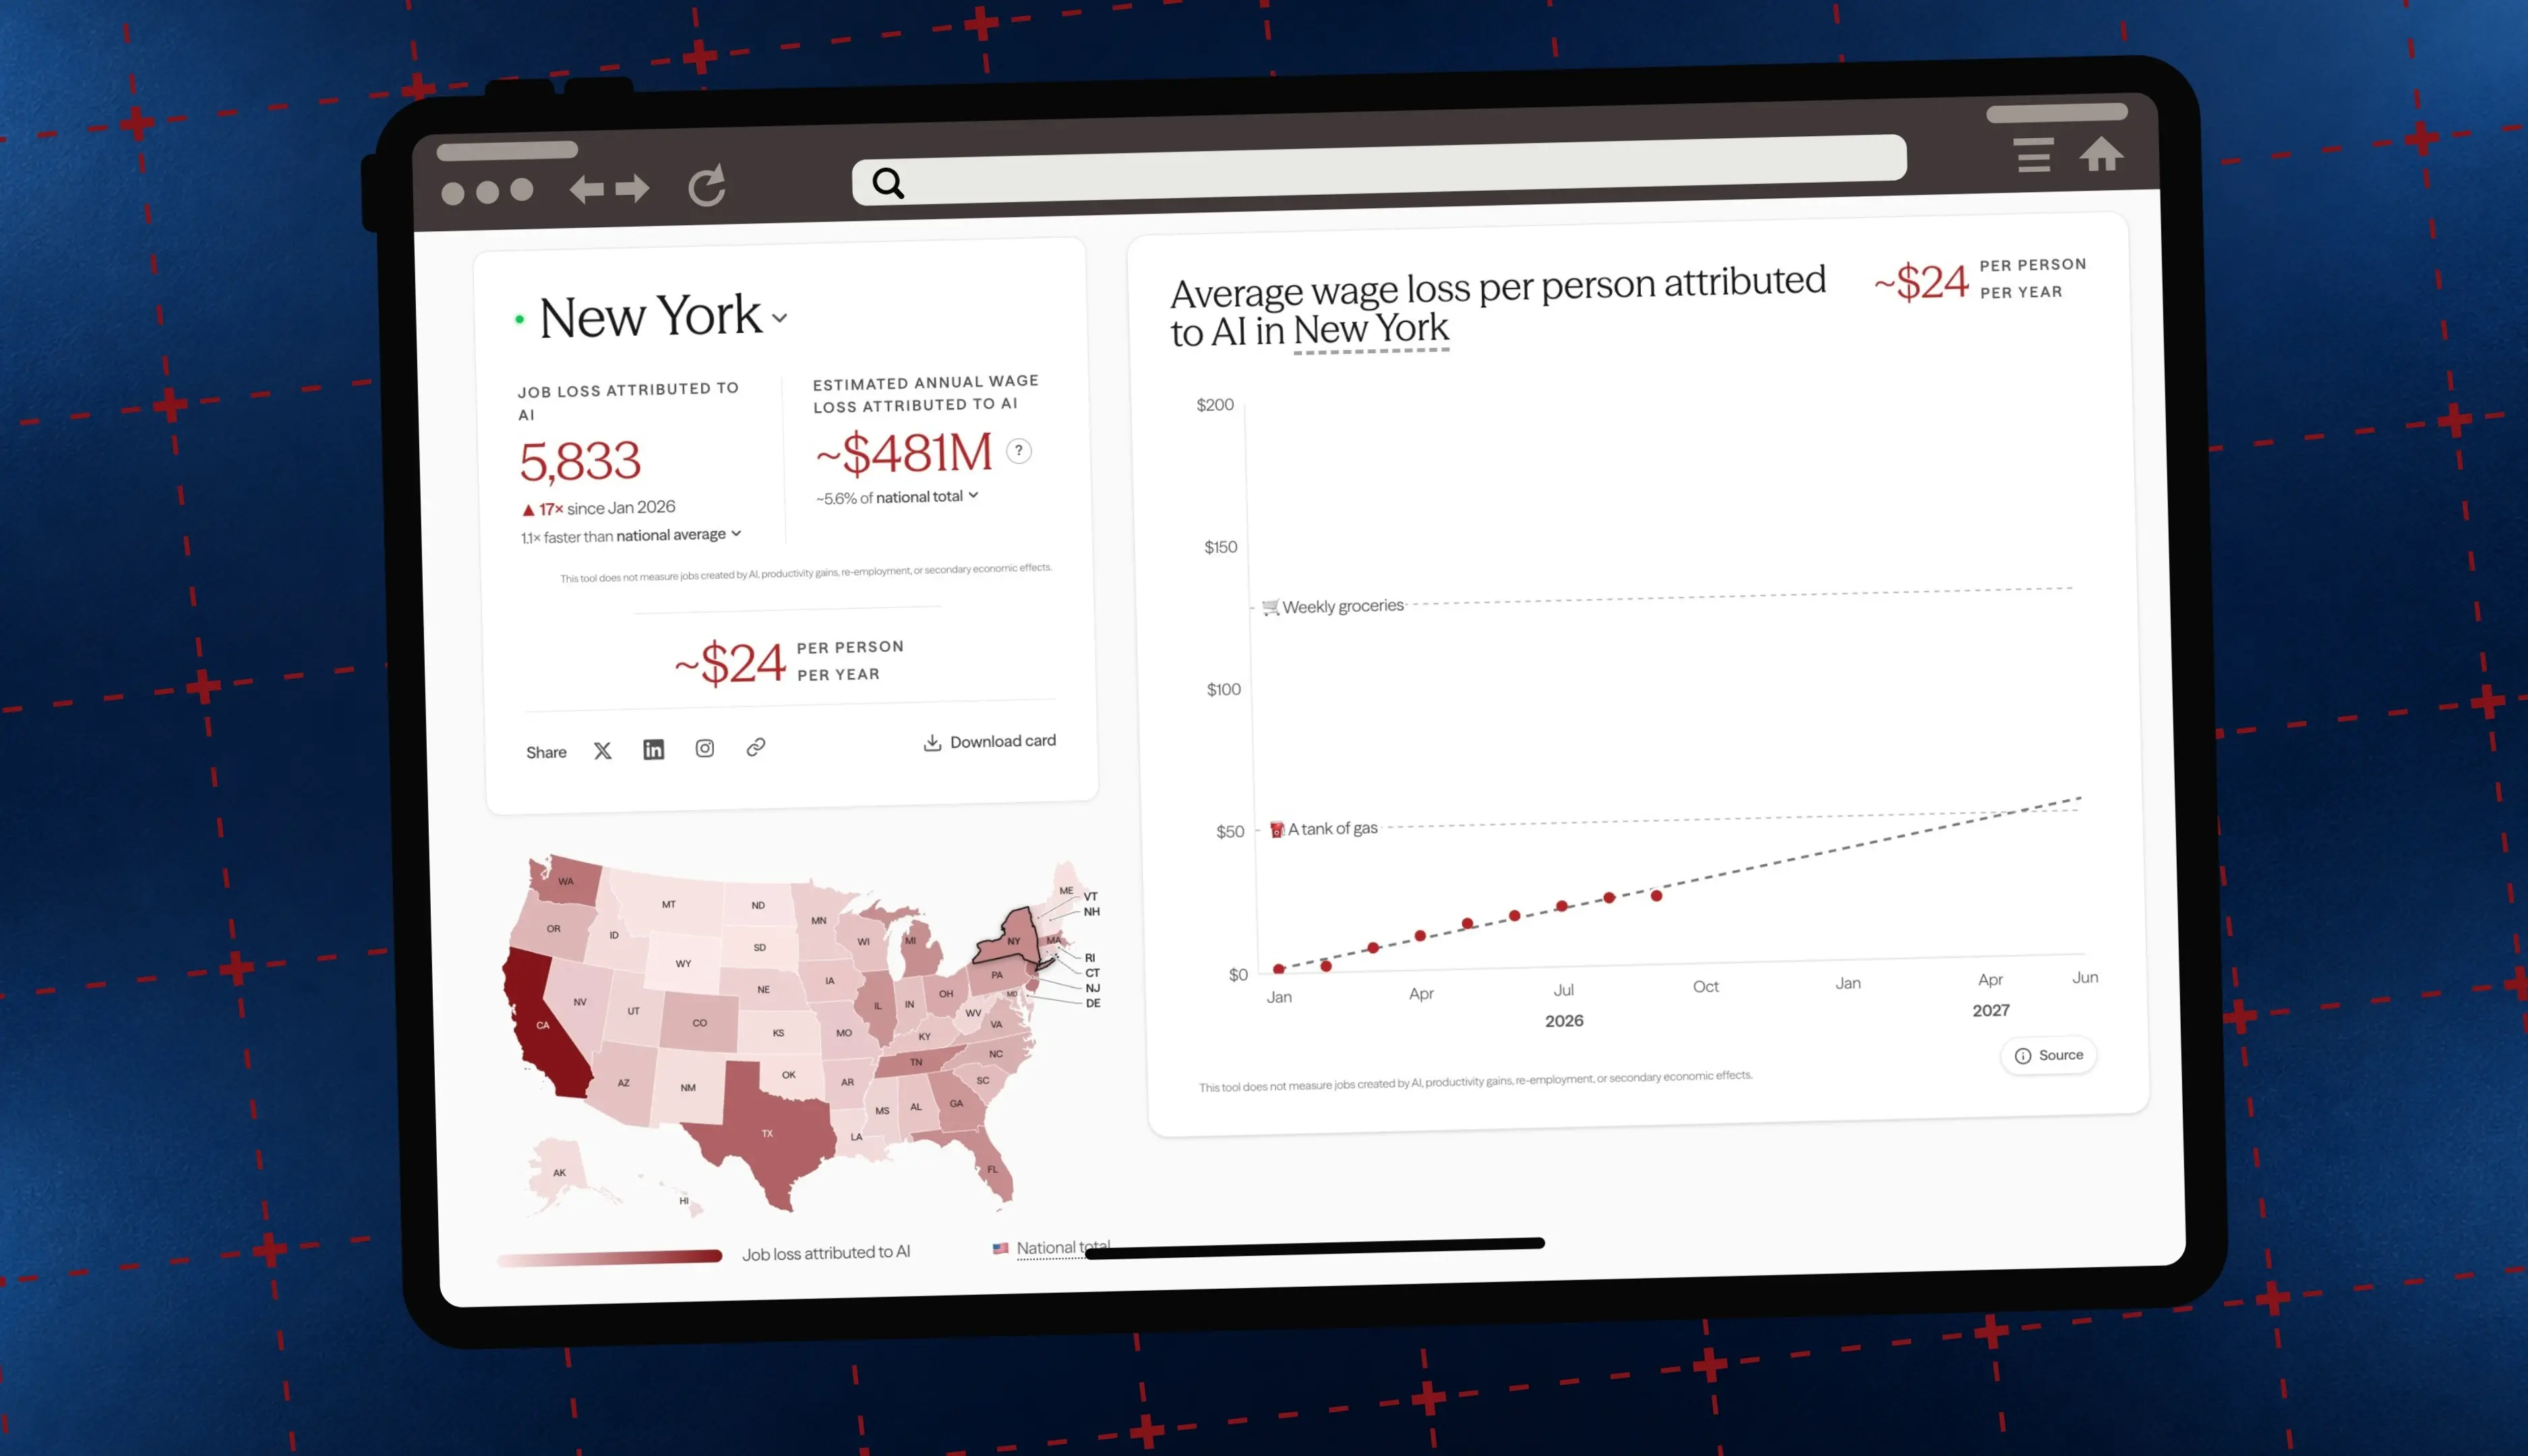
A new public dashboard is trying to answer a question that has mostly been debated in headlines and boardrooms: what does AI-related job loss actually cost workers and communities? The tool estimates how many layoffs have been tied to AI, places those cuts on a state map, and converts the lost jobs into estimated annual wage losses. It is an attempt to move beyond abstract warnings about automation and show the financial weight of workforce changes in dollars and cents.
The project arrives after several years of steady layoffs at large companies and growing anxiety about AI’s role in hiring and firing decisions. Some of that anxiety has been amplified by technology executives and labs eager to promote their own relevance. But some job cuts have been explicitly linked to AI’s rapid acceleration, and the dashboard focuses on those cases. It also highlights a broader point: one person’s layoff can mean less income for every business that person supports, from grocery stores to landlords to local service providers.
Key facts at a glance
- The dashboard tracks AI-attributed job cuts and estimates the resulting annual wage losses.
- Nationally, it counts just over 117,000 AI-attributed job cuts this year and about $8.5 billion in estimated annual wage losses.
- The average estimated wage loss is about $25 per person per year nationally.
- State estimates vary widely: California is estimated at $56 per person, while Alaska is estimated at $14 per person.
- The tool uses monthly layoff announcements, average wage data, and population estimates to produce its figures.
- It does not count jobs created by AI, productivity gains, re-employment, or secondary economic effects.
- A separate remote-work benchmark shows AI agents improving at real freelance tasks, though capability does not equal actual job displacement.
National numbers and state differences
As of its latest update, which includes September data, the dashboard finds just over 117,000 job cuts attributed to AI nationally this year. Those cuts translate to an estimated $8.5 billion in annual wage losses. The national per-person estimate is about $25 per year. That figure may sound small in isolation, but it is an average, and averages can hide sharp differences between states and industries.
California, for example, shows an estimated $56 per person per year. The state has a much higher concentration of AI-attributed cuts, with just over 27,000 layoffs linked to AI in the dashboard’s estimate. Alaska, by contrast, shows only 138 job losses and an estimated $14 per person. Those numbers are not exact counts of people who lost jobs because of AI in each state. Instead, they are modeled estimates designed to show relative pressure across state economies.
The nonprofit behind the dashboard explains that it estimates AI-attributed cuts for each state, converts them to estimated annual wage loss, and divides by state population to estimate the average loss per person. State estimates are not observed AI layoffs. The method applies each month’s national share of cuts citing AI to that state’s announced job cuts. That approach helps fill gaps in state-level reporting, but it also means the figures should be read as estimates rather than precise tallies.
How the estimates are built
The dashboard draws on several data sources. It uses monthly reporting from a national outplacement firm that compiles layoff announcements across the country by state, as well as national job cuts credited to AI. It also uses federal wage data on every state’s annual mean wage and population estimates from the US Census Bureau. By multiplying the number of AI-attributed job cuts by an average annual salary, the dashboard estimates annual wage loss. According to the project, those wage estimates begin to show what the cuts can mean for households and local economies.
The dashboard also displays estimated average wage loss per person relative to everyday expenses, such as a tank of gas. That framing is meant to make the numbers more tangible. A $25 annual loss per person nationally may not seem dramatic, but the state-level comparisons show how concentrated cuts can create larger local effects. In tech- and media-heavy states, the estimated impact is higher because the share of AI-attributed layoffs is higher.
The data have a longer backdrop. In 2025, monthly layoff reports identified more than 54,000 job cuts that companies publicly linked to AI. That translated to about one in 20 layoffs from last year. Tracking job losses alone can feel abstract, especially when the numbers are large and spread across industries. The dashboard’s purpose is to connect those cuts to the finances of the people who experience them and the communities that depend on their spending.
The limits of counting AI layoffs
The dashboard comes with important caveats. It does not include jobs created by AI, productivity gains, re-employment, or secondary economic effects. That omission is partly a reflection of uncertainty: experts do not agree on whether or how much AI will stimulate the economy or outpace job displacement. The technology may create new roles, make existing workers more productive, or change tasks without eliminating positions. Those possibilities are real, but they are difficult to measure in a single dashboard.
AI-attributed layoffs are themselves murky. The data here are job cuts that companies themselves said were tied to AI. Without a single definition of what that means, or complete transparency from companies, it is not always possible to prove that a layoff was the direct result of obsolescence or replacement spurred by AI. A company might cite AI as part of a broader restructuring, cost-cutting plan, or strategic shift. That makes the category broad and, at times, ambiguous.
Other trackers have tried to address the ambiguity with stricter criteria. One tracker catalogs job loss data by company, date, and how explicitly companies cited AI around those layoffs. Because the data can be amorphous, it only logs layoffs that meet certain thresholds, such as at least 100 jobs in one fell swoop and some mention of AI or proxy terms like automation and productivity. The goal is not to capture every possible case but to create a more consistent record of the cuts that are most clearly connected to AI.
The dashboard’s organizers say they are not trying to shame any particular industry or company for its AI adoption choices. Their stated goal is to make the costs of that adoption visible so workers, communities, and policymakers can respond with real information instead of guesses. That distinction matters. AI is being adopted for many reasons, including cost pressure, competitive dynamics, and genuine productivity gains. The dashboard focuses on one slice of that story: the job cuts and wage losses that companies have publicly linked to AI.
From layoffs to local economic ripples
The economic effects of a layoff do not stop at the individual worker. A lost paycheck can mean less spending at grocery stores, restaurants, and small businesses. It can affect rent payments, local tax revenue, and the demand for services. When thousands of workers in multiple industries lose jobs, those ripples can compound. The dashboard’s organizers argue that one person’s layoff means less income for every business they support, and that multiplying that effect across thousands of workers reveals the real economic weight of AI displacement.
Those effects are not spread evenly. States with large tech and media sectors are experiencing greater impact, according to the project. That pattern makes sense: those industries have been among the most vocal about AI adoption and among the most likely to cite automation in restructuring plans. But the concentration also means that national averages can understate the pressure in specific labor markets. A state with a smaller number of cuts may still feel a sharp local shock if the job losses are clustered in one city or one industry.
The dashboard’s per-person framing is an attempt to make those differences legible. A national average of $25 per person per year is modest, but California’s estimated $56 per person is more than double that figure. Alaska’s estimated $14 per person is lower, reflecting both fewer estimated cuts and a smaller population base. These comparisons are not a final verdict on AI’s economic impact. They are a way to visualize where the pain may be concentrated while the broader debate continues.
AI agents and remote work
The dashboard also includes a section on how well AI is completing remote freelance tasks. Using a benchmark that tests agents on real-world freelance work such as web development and video production, the project shows how quickly agents are evolving. When the benchmark launched, the best AI agent completed just 2.5% of projects at professional quality. Eight months later, that number had risen to 15.8%. In more recent testing, the best-performing model could fully automate 21.25% of remote tasks, the highest result in the group’s testing, followed by another leading model.
Those figures are striking, but they need context. The benchmark measures what AI models are capable of doing, not what they are actively taking on. A model that can complete a task does not necessarily mean a company will use it to replace a freelancer. Cost, quality, reliability, legal risk, and client expectations all shape adoption. Still, the project maintains concern about what it sees as a trend: the convergence of AI-attributed job cuts with increasingly work-capable agents. The two data points do not prove causation, but they add to the urgency of the debate.
The policy landscape is also shifting. Legislation cannot explicitly prevent companies from choosing AI systems over hiring humans in every case, but recent laws in a few states, including tech-heavy California, aim to ensure that firing and other disciplinary decisions are not completely automated by AI systems. Those laws reflect a growing recognition that AI’s role in the workplace is not only about which tasks can be automated. It is also about how decisions are made, who is accountable, and what protections workers have when algorithms influence their livelihoods.
The dashboard’s broader contribution is visibility. It takes a diffuse and often speculative debate and attaches numbers to it, even if those numbers are imperfect. It shows where AI-attributed cuts are concentrated, how much annual wage loss they might represent, and how those losses compare across states. It also makes clear what is not counted: new jobs, productivity gains, re-employment, and secondary effects. Those omissions are not minor. They are the difference between a partial snapshot and a full accounting of AI’s economic impact.
For workers and policymakers, the value of the tool may lie in the questions it raises. Which communities are most exposed? How quickly are AI capabilities improving? Are companies citing AI as a genuine cause of layoffs or as a convenient explanation for cuts driven by other pressures? The dashboard does not answer all of those questions. It does provide a starting point for tracking the costs that are already being recorded, one state and one layoff announcement at a time.
Source:ZDNET News